
Ask yourself, do you think velocity is a good metric? Both recently anointed agilist and experienced executives are obsessed by team velocity. But I see issues with using this metric. How will you calculate it? Will you use relative story points, t-shirt sizes, or something else? How will you know if that rate is good or bad, or relative to other teams?
I see metrics generally falling into two categories:
The data is interesting to look at. These are commonly referred to as vanity metrics.
The data will help inform a decision.
If you reason by first principles, it should eliminate velocity from consideration as a primary metric, to inform a decision. A first principle is undeniable and can not be deduced. I believe variance is a better choice.
If an executive wants predictable delivery and we’ve defined predictable as operating within a threshold or control limit, you can look at the value and answer True or False.
Let’s talk about Variance
In my use case, the purpose of this metric is to understand if a team or group of teams are unpredictable enough during a set time period, to warrant a change in the system of delivery.
Sum all accepted {items} by the team or group of teams from the last {time dimension}. Do the same for the preceding two (equal) time increments. These data points will give us what we need to properly calculate our level of predictability.
Why 3 time increments and not more or less?
We want to see a trend line, in order to forecast what will happen next. Now, a straight line can be drawn using just 2 points, and this is technically a trend. But how do you know if those points weren’t unexpected or outliers? Maybe the trendline isn’t actually linear, but exponential, or logarithmic?
The more data points you add, the more information we have, but the more time that has elapsed. You want a persevere or pivot opportunity as soon as possible. You will lose the benefit of the metric, if you wait too long to decide to make changes in your system of delivery.
The Calculations
We need to understand two primary data points, relative to the team or group of teams, over the last three time increments.
What is the standard deviation (σ) of the items delivered?
What is the mean (average) (μ) of the items delivered?
What is the coefficient of variation (σ/μ=Cv) of the items delivered?
In isolation, the standard deviation is interesting. But if you calculate the coefficient of variance and apply the threshold, we now have decision criteria.
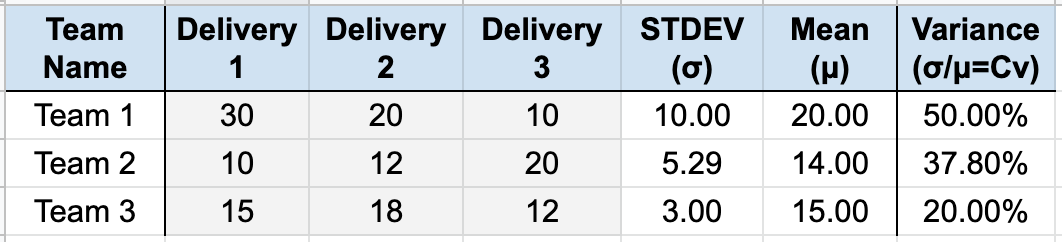
Examples of calculating the Coefficient of Variance
The Thresholds
Above, I listed predictability thresholds of anything greater than 0.5σ (1/2 a standard deviation) or having a coefficient of variance greater than 20%. Both are just working examples. To be clear, software development is inherently variable. If we were manufacturing hardware, your threshold would probably be considerably lower. You should expect to have some variation within individual iterations. If the team is too predictable, changes are they don’t have psychological safety and are under-committing. Teams who are unpredictable, either lack self awareness or are generally dealing with some kind of dependency (business, organizational, or technical).