BLOG
Most Recent Posts
Most recently, I've been writing about organizational level change and how you improve your outcomes and key results.
One of my responsibilities at Atlassian is to shape how we position our solutions within evolving market trends. I was asked to write a series of blog posts to help articulate the position. Below is an excerpt. To read the entire post or download the whitepaper, just select the button.
In its earliest appearances in English, in the 16th century, heyday was used as a noun meaning "high spirits." This sense can be seen in Act III, scene 4 of Hamlet, when the Prince of Denmark tells his mother,
You cannot call it love; for at your age / The heyday in the blood is tame….
If Agile high spirits were in Act III, I would say that we are now in Act IV.
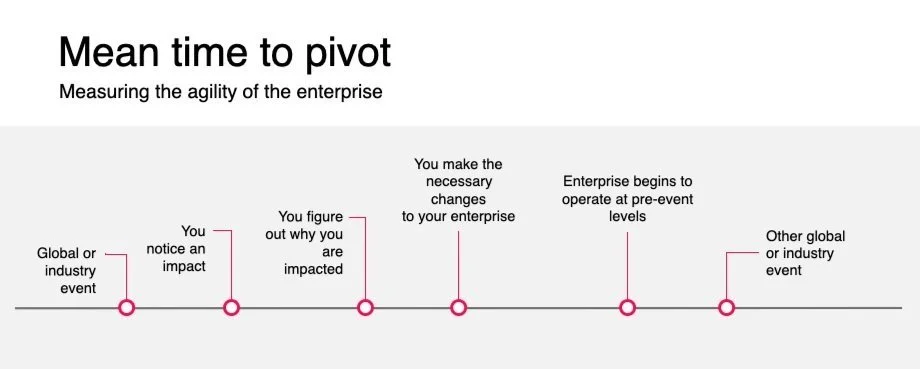
As an executive, you will be faced with the choice to do the pivot (if you can) or persevere (if you have no other choice). This will lead to a series of “bets”. You lead with a hypothesis that the things you change will allow you to operate at pre-event levels. But, how long will it actually take for you to validate your hypothesis and have a bet pay off with pre-event levels? If you run out of time to figure it out or run out of bets you can place, then you either lose your standing in the market or worse risk going out of business.
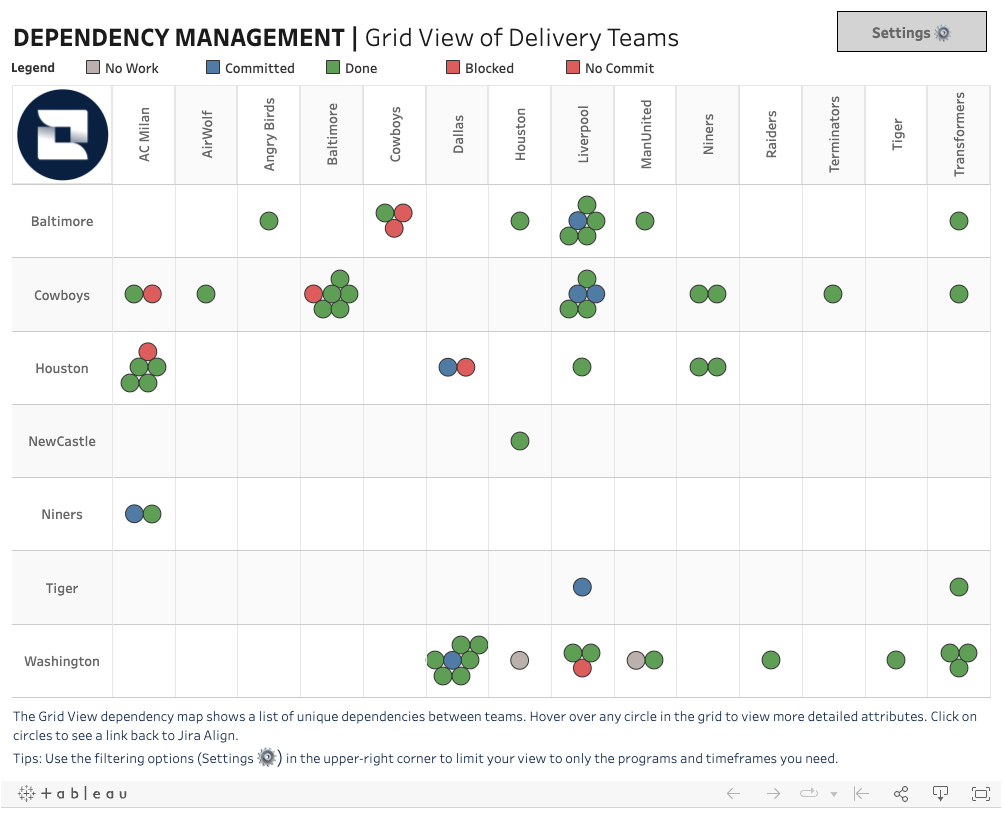
Regardless of the organization or institution, there will always be dependencies. The larger the organization, the greater chance of the existence of dependencies.
This template is available for download from Tableau Public
In the following interview (both video and audio), Dave Prior and I explore why Value Stream Management is so important, how it works, the connection to Value Stream Mapping, and how you can get started with it.
Key performance indicators (KPIs) are metrics that are used to evaluate the performance of an organization or individual. They are used to measure progress towards achieving specific goals or objectives and to determine whether an organization or individual is meeting their targets.


