A few years ago, we had a house built in rural Maryland. Working through a builder, we designed the layout of our home and painlessly moved into our newly constructed home about 6 months later. After we took full ownership of the house, there were minimal construction issues (a few nail pops). Fast-forward a year.
Take a fresh look at LinkedIn Connections
Outcomes > Outputs
| Choice 1 | Choice 2 | |
| A | 0 | 150 |
| B | 10 | 140 |
| C | 20 | 120 |
| D | 30 | 90 |
| E | 40 | 50 |
| F | 50 | 0 |
Today, I want to challenge people to think differently about what they do every day. It's not enough to just be busy. That's called output. I believe we need greater focus on outcomes.
Time is a resource that can't be saved. It can only be spent. In the end, we're exchanging a limited resource for something of value. All things being even, in the table and graph above, we're asked to split our time between creating Choice 1 and Choice 2. If we spend all of our time creating Choice 1, we'll have no time available for Choice 2. The graphical curve provides a visualization of what combinations are possible. Anything to the left of the curve (red) is possible. Anything to the right of the curve (blue) is not possible. We have to decide.
The graph is something some may remember as a principal of economics; the Production Possibilities Curve.
“An economy’s factors of production are scarce; they cannot produce an unlimited quantity of goods and services. A production possibilities curve is a graphical representation of the alternative combinations of goods and services an economy can produce. It illustrates the production possibilities model. In drawing the production possibilities curve, we shall assume that the economy can produce only two goods and that the quantities of factors of production and the technology available to the economy are fixed.”
You and your delivery team are the economy and you have to choose what you are going to work on, given you have limited time. The choice above is unnecessarily complicated because it only focuses on output. I challenge you to think about the contributions of the curve, leading with an outcome perspective. Given the economy is fixed, what choices would give you disproportionate value? What outcome(s) provide the greatest benefit to your customers?
So, next time you prioritize your work, consider both the amount of time it takes to complete the work and value it will provide.
Velocity Metric and the Cobra Effect
The cobra effect occurs when an attempted solution to a problem makes the problem worse, as a type of unintended consequence.
History
According to reports from the 1800s, the British Empire wanted to reduce deaths caused by cobra bites in Delhi. Thinking the best solution was to reduce the number of cobras, the locals were offered a financial incentive for every cobra skin. Some locals saw an opportunity to earn money by farming cobras. When the government become aware of this, they removed the incentive, cobra farmers released their snakes, and the overall cobra population increased.
Applying to Metrics
Let's use a metric like Velocity, for example. Management wants the teams to deliver more product so it can get more returns on its investment. Management begins to measure how much the teams are completing, by linking productivity and velocity (rather than to use it to understand capacity). To make things more interesting, not only does management ask the teams how much they can produce but then offers some kind of incentive for reaching the velocity goal. What do you think will happen?
Velocity
At the end of each iteration, sprint or planning increment, a team adds up estimates associated with work that was completed during that timeframe. This total is called velocity. If you're using a flow-based approach, you may call this throughput or something else. Either way, we're trying to measure stuff we got done and that we could potentially ship. If you have a stable team and stable velocity, you could better understand team capacity for future commitments.
The Effect
If you're not careful, incentivizing teams around velocity may have the cobra effect. First, they may throttle back their commitments. Week one they commit to 100 points. The next week they commit to 80 points. If they get everything done that they commit to, they get the reward and management gets 20% less delivered. Alternately, the team may begin to pad their estimates. Week one they commit to 100 points. The next week they pad every estimate by 20%. They still commit 100 points. They just inflate estimates for the same effort. Again, they are rewarded.
What can you do?
First, if you can't link your metric back to the key results you're looking for or the outcomes you desire, it's probably a bad idea to use this metric. Know why you need this information! I use velocity to understand team capacity. That's it! Remember that choosing to use this metric comes with risks. When you're trying to measure people, there has to be a certain level of trust and safety. You trust the people giving you the estimates are being honest and forthcoming. You trust that they understand why (you believe) the data is important to you and the company. You will get bad information, if the team does not feel safe. Don't use this metric as a stick to punish them. If you do, this metric can most certainly come back and bite you.
How to Use Metrics to Reach Better Business Outcomes
Most organizations I deal with think the more metrics they have, the better off they are. To the contrary, collecting metrics data takes time. If the metrics you're reporting on are not valuable, then that time you spent collecting data is all wasted time. So, the following is not intended to be an exhaustible list of indicators or instructions. Rather, the intent is to provide context on how anyone can glean information from metrics to demonstrate results toward better business outcomes.
This post focuses on an organization's desired to have its Scrum Delivery Team predictably meeting its release or milestone commitments.
I will lay out the process in 5 step.
Know what outcomes look like.
Know how to demonstrate key results toward an outcome.
Know what metrics should be used to measure key results.
Know where metrics data will originate from.
Know collection methods and frequency of the metrics data.
Theory: Monitoring Goals
A journal article* from 2016 supports the suggestion that monitoring goal progress is a crucial process between setting and attaining the goal. Additionally, the article* stated that progress monitoring had a larger effects on goal attainment when the outcomes were reported or made publicly available, and when the information was physically recorded.
I believe leading indicators are the mechanism by which we monitor goal progress and reviewing that progress frequently by way of dashboards provides the larger effects of goal attainment.
*Psychological Bulletin, Vol 142(2), Feb 2016, 198-229
Assumptions
For this post, I will assume you are already familiar with LeadingAgile's Compass. Comparing the planning characteristics of a company with the planning expectations and needs of the client allows you to put your company, or your division, or even just your product area into one of four quadrants. The four quadrants will help you understand more clearly some of the challenges you might experience meeting customer expectations, why you are struggling or might struggle to adopt agile, and how to talk about the steps necessary to safely and pragmatically move your organization forward.
For this blog post, I am focusing on organizations that are actually in alignment with their customers expectations, but may struggle making and meeting commitments due to lack of clarity around the requirements, poor estimation, and extreme variability in the rate in which individuals can actually complete work against the estimates. These organizations often have highly structured PMO organizations, very disciplined governance, long-term planning and tracking processes, but still struggle to make and meet commitments on a regular basis.
Understand Goals and Outcomes of Going Agile
Your journey toward greater business agility starts by identifying what outcomes are most important to your company’s success. This knowledge helps you lay a foundation for making decisions about how to tailor your approach to measurably show progress toward your critical business objectives. For this blog post, our goal is Greater Predictability.
Step One: Define the Desired Outcome
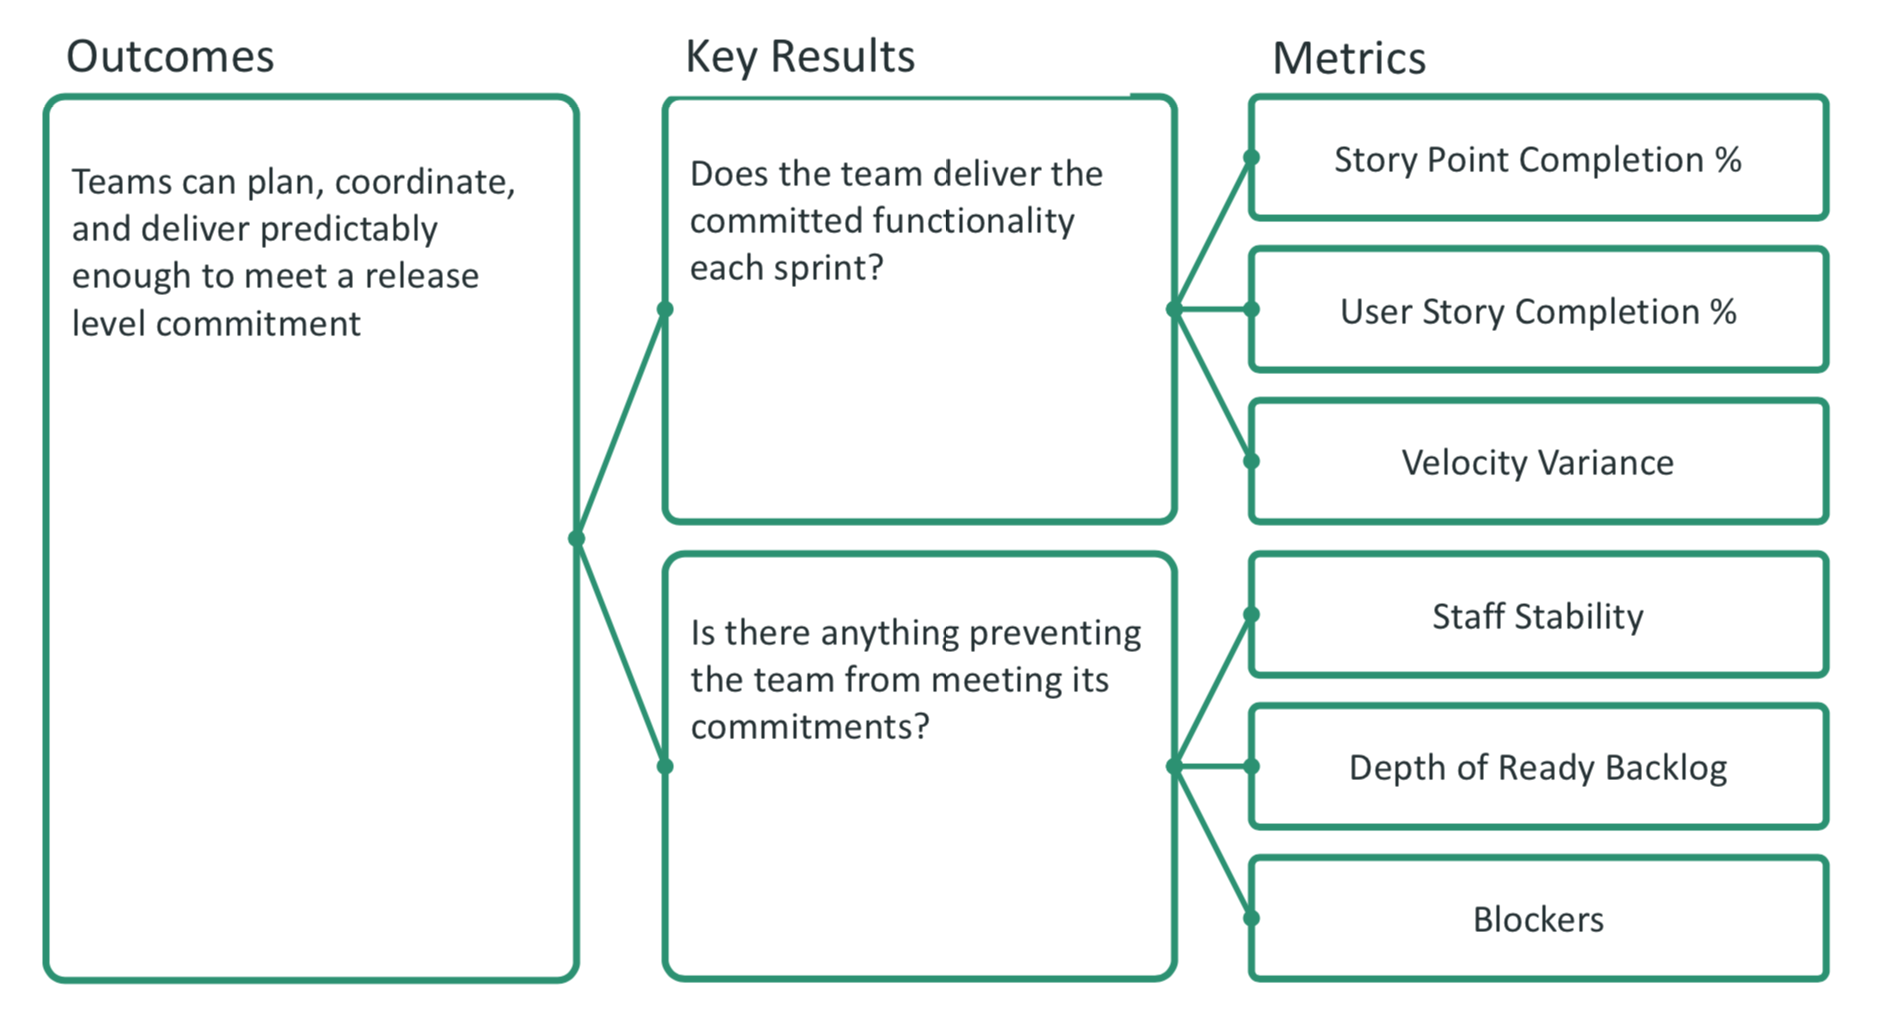
In our example, our desired outcome is to have teams plan, coordinate, and deliver predictably enough to meet a release level commitment.
But what do we need for this outcome?
Backlogs
Backlog items need to be appropriately sized. They need to be ordered and prioritized to capture work needed to develop product or deliverables.
Stable Team
A stable team has everyone and everything (skill sets, tools, etc.) needed to deliver working, tested, documented, deployable product.
Working Tested Product Increment
This means deliverables meet defined acceptance criteria, have been reviewed and approved by product owner/ stakeholders, have been tested, and are shippable.
Step Two: Align Key Results to Desired Outcomes
For our example, I will list two key results:
The team delivers the committed functionality each sprint.
There is nothing preventing the team from meeting its commitments.
Step Three: Identify Metrics to Measure the Key Results
The team delivers the committed functionality each sprint.
Story Point Completion Percentage
User Story Completion Percentage
Velocity Variance
There is nothing preventing the team from meeting its commitments.
Team Stability
Depth of Ready Backlog
Outstanding Blockers
The key results are also known as lagging Indicators. The metrics to measure them are known as leading indicators. You can read more about leading and lagging indicators here. The important distinction is that a lagging indicator is one that usually follows an event. You can use the leading indicators to make changes to your behavior or environment, resulting in more positive key results and better outcomes.
Step Four: Know Where to Get The Data
Any of the major Agile ALM tools will provide leading indicators. You just need to know what is a meaningful indicator. Atlassian JIRA, CA Agile Central, VersionOne, VSTS... They all work. I also don't discount the value of physical boards and spreadsheets. But since most of the people I'm working with are struggling with many teams working at once, an ALM tool can pay for itself through less duplication of effort and higher quality of data.
Step Five: Collection Method and Frequency
Let's use Story Point Completion Percentage as an example leading indicator. Capture key information about the metric, to ensure there is a shared understanding. Metric description, how its calculated, when to measure, acceptable thresholds, and the source location are all critical for us to have a share understanding.
An example would looks like this:
Description:
Story Point Completion Percentage measures Delivery Team predictability. It is strongly correlated to the team’s stability and governance ability to manage dependencies.
Metrics Calculation
Total Story Points (Accepted) / Total Story Points (Committed)
When to Measure
Committed Story points are calculated at Sprint Planning; Accepted at Sprint end.
Thresholds
>=90% (Green) | 80-89% (Yellow) | < 80% (Red)
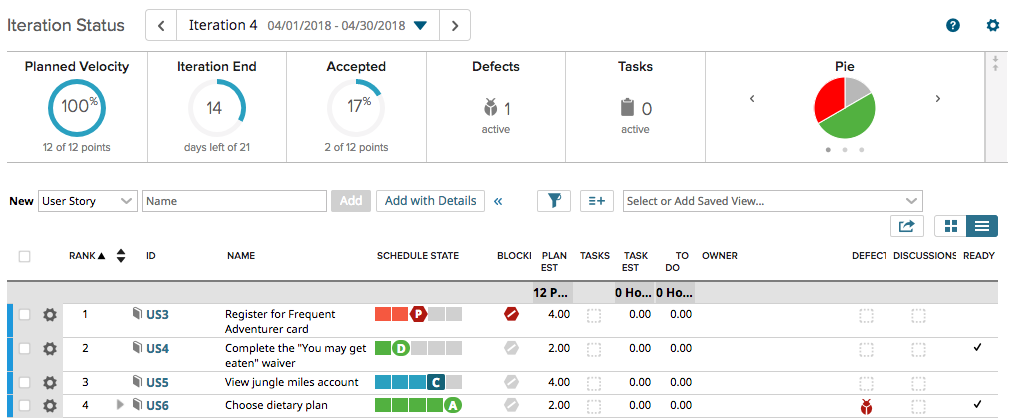
ALM tool (CA Agile Central) Source
Story Point Completion Ratio in CA Agile Central
I have documented collection methods in all of the major ALM tools. I'm just going to use CA Agile Central for our example. Within an CA Agile Central active project, navigate to the Iteration Status page. One of the helpful elements of this page is the ability to see if the team has committed to an appropriate level at Sprint Planning (Planned Velocity graph) and how they are progressing toward the end of their Sprint (Accepted Velocity graph). Point Completion Ratio is calculated by using the Accepted Velocity graph. (N of N points)
Summary
As noted early, leading indicators are the mechanism by which we monitor goal progress and by reviewing that progress frequently via dashboards, we increase the odds of reaching the goal. Use dashboards (with meaningful metrics) to monitor your progress.
Agile Baltimore on March 2, 2018
We fought the wintery and windy bomb cyclone to meet for coffee and conversation. Traffic sucked. There were trees down. Thankfully, there was power, heat, and coffee!
What we discussed
*** Product First or Process First. How do you solve a problem?
**** Requirements - From business translating to tech.
**** Why do organizations fail to address cultural issues before implementing Agile?
Hands-on experience dealing with EPMO/Compliance and Agile
What management practices impede Agile? How to address?
*** Agile in FDA compliance environment
* Bugs on Scrum Team
Managers. How do you deal with them?
* Topics with the most stars were discussed first.
What are your thoughts on the topics? Conversation and respective dialog welcome.
Never Break The Chain
With an ongoing quest to be as productive as possible and continue forming good habits, I decided to test a new strategy this last week. It's called “never break the chain”.
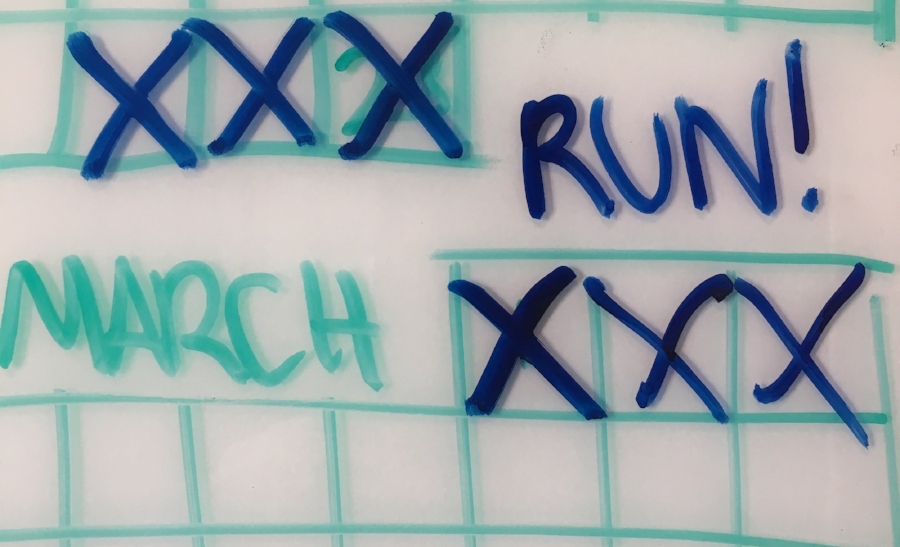
Years ago, comedian Jerry Seinfeld shared the biggest secret of his continued success. When Seinfeld was a new television show, Jerry Seinfeld was still a touring comic. He said the way to be a better comic was to create better jokes and the way to create better jokes was to write every day. Specifically, each January, he hangs a year-at-a-glance calendar on a prominent wall of his office, and for every day that he writes new material, he gets to mark a big “X” over that date. After a few days, a chain of Xs begins to form. The goal is to NOT break the chain, and write every single day.
Keep at it and the chain grows longer every day. You'll like seeing that chain, especially when it stretches past a few weeks. Your only job next is to not break the chain.
The goal of writing every day for a year, in the case of Jerry Seinfeld, sound impossible. But, if you can just focus on the single daily goal of "write something today", it becomes much more attainable.
Not only does this approach program the body and mind to do something daily, it also motivates you to continue that long string of Xs. If you don't do your goal one day, you don't get to draw the X. That pressure could be just enough to keep you going.
It doesn't particularly matter what your goal is. It can be anything, as long as you're actively and routinely pushing yourself. Daily action builds habits. It gives you practice and will make you an expert in a short time. If you don't break the chain, you'll start to spot opportunities you otherwise wouldn't. Small improvements accumulate into large improvements rapidly because daily action capitalizes on previous improvements.
As I noted in a previous blog post, to be productive you need 3 things: A system, ritual, and habit.
System: Never Break The Chain
Ritual: Mark X on calendar for every day you accomplish your task
Habit: Complete your task every day without breaking the chain
Podcast on Leading and Lagging Indicators
In this episode of LeadingAgile’s SoundNotes, Dave Prior and I take on the topic of Leading and Lagging Indicators. During the podcast we discuss how Key Performance Indicators (KPIs) can help guide you toward an understanding of what to track with the expectation that it will create a certain result in the future (leading indicators), and what to measure in order to confirm if that result has in fact occurred (lagging indicators). One example we touch on in the podcast is: if you are trying to lose weight, tracking things like how much you exercise and how many calories you are consuming each day are leading indicators because it is reasonable to expect that if you are exercising regularly and limiting your caloric intake, that these actions could result in you losing weight. This is a way of tracking the actions you are taking to in order to bring about a desired change. But, we still need a way to confirm if the desired result has actually occurred. The only way you will know if you have actually lost weight, is to climb up on the scale and check your weight. That is a lagging indicator because it confirms whether or not the actions you took had resulted in the desired outcome. https://youtu.be/nvOEUn0-SLY


