Blog — Derek Huether

Planning

Risks and Benefits of Cost-Reimbursable Contracts

brokenpig

As I mentioned in my previous post, Fixed-Priced Contracts, there is no ONE best type of contract to manage. The risk the vendor and customer share is determined by the contract type. The best thing you can do is understand the risks and benefits of each. There are three categories of contracts: Fixed-Price, Cost-Reimbursable, and Time and Material (T&M). In this second installment of a 3 part series, I will define the contracts in the cost-reimbursable category. It will hopefully help you on the PMP exam and out in the real world.

Cost-reimbursable is a contract category involving payments (cost reimbursements) to the seller for all legitimate actual costs incurred for completed work, pus a fee representing seller profit.  Cost-reimbursable contracts may also include financial incentive clauses whenever the seller exceeds, or falls below, defined objectives such as costs, schedule, or technical performance targets.  Three of the more common types of cost-reimbursable contracts in use are Cost Plus Fixed Fee (CPFF), Cost Plus Incentive Fee (CPIF), and Cost Plus Award Fee (CPAF).

A cost-reimbursable contract gives the project flexibility to redirect a seller whenever the scope of work cannot be precisely known and defined at the start and needs to be altered, or when high risks may exist in the effort.  Frankly put, if the buyer doesn't know what they want, this type of contract allows the project to move forward without the risk to the seller.

  • Cost Plus Fixed Fee (CPFF) reimburses the seller for all allowable costs for performing the contract work, and they then receive a fixed fee payment calculated as a percentage of the initial estimated project costs. The fee is paid only for competed work and does not change regardless of seller performance. The fee amounts do not change unless the project scope changes.

  • Cost Plus Incentive Fee (CPIF) reimburses the seller for all allowable costs for performing the contact work and receives a predetermined incentive fee based upon achieving certain performance objectives as set forth in the contract. In CPIF contracts, if the final costs are less or greater than the original estimate costs, both the buyer and seller share costs from the departures based upon a prenegotiated cost sharing formula, e.g., an 80/20 split over/under target costs based on the actual performance of the seller.

  • Cost Plus Award Fee (CPAF) reimburses the seller for all legitimate costs, but the majority of the fee is earned, based on the satisfaction of certain broad subjective performance criteria. This performance criteria is defined and determined by the buyer and and incorporated into the contact. The determination of the fee is based solely on the subjective determination of seller performance by the buyer, and is generally not subject to appeals.

Image Source: Pictofigo

The Best Kind Of Contract To Manage Is...

  Unfortunately, there is no ONE best type of contract to manage.  The risk the vendor and customer share is determined by the contract type.  The best thing you can do is understand the risks and benefits of each.  There are three categories of contracts: Fixed-Price, Cost-Reimbursable, and Time and Material (T&M).  In this 3 part series, I will define the contracts in each category.  Hopefully, it will help you on the PMP exam and out in the real world.

Fixed-Price is a category of contract involving setting a fixed total price for a defined scope of work to be provided.  Fixed-price may also incorporate financial incentives for achieving or exceeding selected project objectives, such as schedule delivery dates, cost and technical performance, or anything that can be quantified and subsequently measured.   Sellers under fixed-price contracts are legally obligated to complete such contracts, with possible financial damages if they do not.  Under the fixed-price arrangement, buyers must precisely specify the products or services being procured.  Changes in scope can be accommodated, but generally at an increase in contact price.

  • Firm Fixed Price Contracts (FFP) are the most commonly used contract type.  It is favored by most buying organizations because the price for goods is set at the outset and not subject to change unless the scope of work changes.  Any cost increase due to negative performance is the responsibility of the seller, who is obligated to complete the effort.
  • Fixed Price Incentive Fee Contracts (FPIF) are arrangements which give the buyer and seller some flexibility whereby allowing for deviation from performance, with financial incentives tied to achieving agreed to metrics.  Typically such financial incentives are related to cost, schedule, or technical performance of the seller.  Performance targets are established at the outset, and the final contract price is determined after completion of all work, based on the seller's performance. Under FPIF contracts, a price ceiling is set, and all costs above the price ceiling are the responsibility of the seller, who is obligated to complete the work.
  • Fixed Price with Economic Price Adjustment Contracts (FP-EPA) are used whenever the seller's performance period spans a considerable period of years, as is desired with many long-term relationships.  FP-EPA is a fixed-price contract, but with a special provision allowing for predefined final adjustments to the contract price due to changed conditions, such as inflation changes, or cost increases (or decreases) for specific commodities.  The EPA clause must relate to some reliable financial index which is used to precisely adjust the final price.   The FP-EPA contract is intended to protect both buyer and seller from external conditions beyond their control. 

Next in my series on Contracts, I'll define Cost-Reimbursable and Time and Material Contracts (T&M)

Image Source: Pictofigo

Free Project Team Organization Worksheet

Project Team Organization

Project Team Organization

Today I'm going to write about (and provide) a free Project Team Organization worksheet to complement the Project Charter Template so many have downloaded. Both files are free for download, modification, and distribution. [Team Organization Worksheet] [Project Charter Template] When using the Project Team Organization worksheet, note that there are 4 sections:  Structure, Roles and Responsibilities, and a Responsibility Matrix, Project Facilities and Resources.  I'm going to focus on the first three.

Step 1: Describe the organizational structure of the project team and stakeholders, preferably providing a graphical depiction (organization chart).

Step 2: Summarize roles and responsibilities for the project team and stakeholders identified in the project structure above.

Step 3: Complete the responsibility matrix for each of the project roles. As a graphical depiction of a more detailed perspective of responsibilities, the matrix should reflect by functional role the assigned responsibility for key milestones and activities.

Step 4: Describe the project's requirements for facilities and resources, such as office space, special facilities, computer equipment, office equipment, and support tools. Identify responsibilities for provisioning the specific items needed to support the project development environment.  Hey, you're people need places to sit and equipment to get their work done.

With preliminary approval, copy these values into Section 3 of our free Project Charter Template. Upon Project Charter approval, apply the identified team members to activities in Microsoft Project or your selected Project Management application.

Another thing I would recommend is leverage the data from this worksheet in your Communications Management Plan.  You've already identified people and their roles or responsibilities.  The most important thing to remember is do what makes sense.  This planning worksheet isn't required to do a Charter.  It's supposed to make things easier for you and lower the risk of not knowing who is on your team and what they are responsible for.

[Team Organization Worksheet] [Project Charter Template]

Free Work Breakdown Structure Worksheet

WBS Worksheet

WBS Worksheet

As I look at the logs of the Critical Path website, I notice a trend for what people are searching.  Most visitors coming to this site are searching for project management related templates and worksheets.  If there is one thing I try to instill in other project managers, it is listen to your customers!  That being said, here is a Work Breakdown Structure (WBS) worksheet to complement the Project Charter Template so many have downloaded.  Both files are free for download, modification, and distribution. [WBS Worksheet] [Project Charter Template] When using the WBS worksheet, list the project’s major milestones and deliverables, the corresponding unique identifying numbers, and the target dates for delivery. This list should reflect products and/or services delivered to the end user as well as the delivery of key project management or other project-related work products.

With preliminary approval, copy these values into Section 3.2 of our free Project Charter Template.  Upon Project Charter approval, copy the values from the major milestones column into Microsoft Project or your selected Project Management application and begin creating the activity list (decomposing).

Starting Is Easy; Finishing Is Hard

I once saw (via video podcast) a wise man (Jason Calacanis) say "starting is easy; finishing is hard." When he said that, it was a moment of absolute clarity for me.  I'm not saying he verbalized the meaning of life.  He did state, however, what I've often conceptualized but was never able to verbalize.

What Jason stated in 6 words is what I've seen many colleagues struggle with.  Who doesn't have projects and tasks to complete and deadlines to meet?   I've tried multitasking, thinking it would make me more efficient.  I've tried using a productivity pyramid.   All I did was start more tasks, not finish more.  That's the key right there.  It doesn't matter how many things you start if you never finish them.

The solution to my past problems has been the use of kanbans, referring to them as information radiators.  These information radiators were large billboards strategically placed around the office so anyone could passively see the status of the current project.  You could see what the highest priority was, what was currently being completed, and what was being delayed.

I believe the key to those successes was in the ability to visualize our work.  Everyone knew exactly what they needed to complete and everyone else knew if it was getting done.  People were not allowed to go on to ancillary activities until their assigned tasks were completed.  Another important facet of the kanban, we limited our work-in-progress.  This forced-focus on limited tasks and constant feedback loop is very powerful and very productive.

If you would like to read my complete guest post at the Personal Kanban website, on how I visualize my work and FINISH it (don't forget the comments), just follow the [link].

Meeting PMP Eligibility Requirements

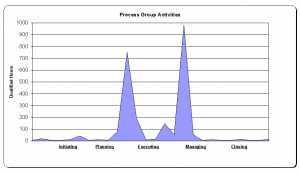
Process Group Activities GraphWhen I was completing my PMP application, back in 2006, I recall reading the eligibility requirements and asking myself where I had the greatest gaps in my project management experience.  PMI did a good job of listing the process groups and activity "buckets" in which I could associate my time.  To visualize my strengths and weaknesses, I identified each activity provided by PMI as a process group subcategory and then associated project hours within a spreadsheet.  Though PMI had a requirement that I document experience in each of the process groups,  I had a personal requirement that I improve where my skills were lacking. This post isn't about my strengths or weaknesses, though you could assume by the graph that it would be Initiating and Closing.  It is about my identifying my experience gaps and helping you identify yours (in the eyes of PMI).  If you're a PMP or an aspiring PMP, take a look at the attached.

Step 1: Review the Process Group Activities PDF.  It will define the subcategories.

Process Group Activities PDF

Step 2: Associate subcategory hours on a project basis.  The formulas are already in the worksheet.  All you need to do is add your hours to the Project Data sheet.

MS ExcelActivity Breakdown By Process Group

Step 3: Review the Graph on the tab titled "Graph".  If you don't identify your strengths and weaknesses from the data sheet, you will certainly see them in the graph.

Best Regards,

Derek

Calculating Initial Velocity On Day Zero

velocity chart

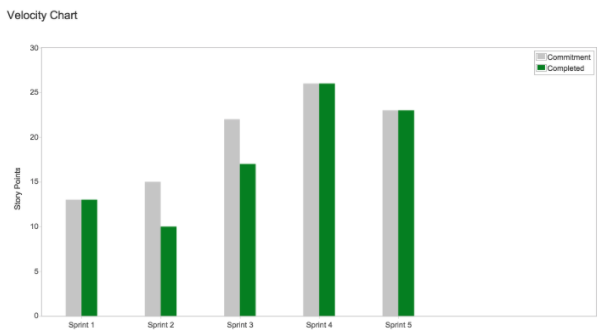
While reviewing proposal documentation yesterday, I noticed the contractor's predicted velocity rate was pretty high.  Being they are not experienced in using Agile and they haven't even started the project, I was curious how they were able to calculate such a high velocity rate for the first iteration.  I know how many developers they intend to use and I know their proposed iteration durations.  I'm not going to get into the specifics as to how they estimated features (user stories, requirements, backlog items, etc.).  So, what did I expect? Velocity is a very simple method for accurately measuring the rate at which teams deliver business value. To calculate velocity, simply add up the estimates of the items successfully delivered in the last sprint or iteration.  What about the initial iteration?

Terms to understand when calculating initial velocity:

  1. Number of Developers – How many developers will you have doing actual work?
  2. Capacity - What is the maximum amount of work one person can accomplish in an ideal situation during the iteration?
  3. Number of Iteration Days – How many work days are in the iteration?
  4. Load (Capacity) Factor - The ratio of the actual work output over a period of time and the output if the developer had operated at full capacity over that time period.  e.g. 1/3 = 2.66 Hours , 1/2 = 4 Hours, 1/1 = 8 Hours
  5. Velocity - How much Product Backlog value a team can deliver in one iteration.

Because you don’t know team velocity for the first iteration, plan initial velocity at one-third of total capacity in order to account for coffee breaks, design, email, meetings, rework, research, etc.  As an example, with seven (7) developers and at one-third (1/3) capacity, a total of 18.62 development hours are available per day.  Multiply the number by the number of work days in the sprint to arrive at the total of initial work hours.  These work hours will be applied against your estimated items, to arrive at an initial velocity.

(7 [Developers] * 1/3 [Load Capacity Factor]) * 21 [Work Days] = 44.1 [Ideal Work Days]

Ideally, the team should already be formed and stable, so that you can just forecast.  Unfortunately, this whole scenario is faulted. Not only are estimates for team capacity going to vary wildly, but what about the estimates for the deliverables themselves?  I can get pretty good at estimating a level of effort for work that could take a few days.  But the contractor that was noted in this post was estimating a 3-year project.  By the way, if you're curious, the contractor failed within 1 year. The federal agency then exercised their right to not renew their contract for the option years.  The agency then brought in a new contractor with more Agile experience.