VMS

PMI Global Congress Presentation on VMS

I am back from the PMI Global Congress in Vancouver, British Columbia. My lack of fancy pants went pretty much unnoticed.  I brought plenty of energy (and coffee) to my session and it appears people were very happy with the results.  I was referred to, at one point, as the Energizer Bunny and even the PMI quoted me.

I definitely left people wanting more.  It was an introductory talk and I only had 1:15 to present.  With 20 minutes dedicated to people in the audience working together to create their own Visual Control Systems, I found myself all over the room and loving every second of it.

It was great to meet people I've known for several years via the blog and through the PMI Agile Community of Practice.  It was also great to meet so many new people excited about Agile becoming more mainstream.

Side note: If you saw me limping during my session and at the Congress, it was because I may have a fractured heel.  I guess my OJ Simpson run through the airport to make my flight did it.

Retrospective Shades of Gray

The Retrospective

I love retrospectives.  It doesn't matter if it's an informal process that occurs naturally as team members interact or it is a formal process that occurs at the end of a meeting, an iteration, or a release.  It's an opportunity for the team and organization to make things better.  It most certainly is on the minds of others today.  I've read about the goals of a retrospective on George Dinwiddie's blog and also retrospectives - wronger and righter on Bob Marshall's blog.

I honestly believe we should be constantly looking for things to start doing, stop doing, do less of, do more of, or keep doing to improve the things we do.  I have been a part of projects where a Lessons Learned meeting was part of the Project Closeout activities.  What good is it then!?  We should constantly be learning and constantly trying to make things better.

Shades of Gray

Depending on the team, I may use the four-quadrant grid, starfish retrospective diagram (or both) to capture ideas. I love the format of the four-quadrant grid, in that the team can communicate what is working, what isn't going so well, any ah-ha moments they've recently had, or appreciations they would like to note for their teammates. Unfortunately, just as some organizations or teams think of writing documentation as an afterthought, I see them doing the same with retrospectives.  Retrospectives are a critical component of any process.  Without them taking place, you are pretty much guaranteed to make the same mistakes twice, a third time, ad nauseam.

retrospective starfish

retrospective starfish

When to do it

Don't wait until the end of your current iteration, release, or project to document and improve.  On a team board or flip chart, draw a circle.  Segment the circle into five quadrants: Stop Doing, Do Less, Keep Doing, Do More, Start Doing.  Please note that these are merely recommendations.  The content and order are not retrospective commandments.  Have a stack of Post-It notes and a Sharpie nearby. Encourage the team to add notes to the board when the mood or event strikes them.  Don't wait!

If you struggle to get cards on a regular basis, perhaps a facilitated retrospective is in order.  The act of collecting ideas is not just to make people feel better.  Notes captured on this board are all candidates for conversion to action items.  If you have the fortunate problem of having too many ideas on the board, use a consensus strategy like fist of five or dot voting to identify the most valuable action items.

Keep Doing (=): Capture good things that are happening. As a facilitator, ask the team what they would miss if something was taken away from them.

Do Less (<): Anything that might need a bit more refining or that is simply waste.  Is there something that adds value but not as much as something else could?

Do More (>): Are there value-add activities the team may want to try more of but are not necessarily taking full advantage of?

Stop Doing (-): What are some things that are not very helpful or not adding much value?  My prime target is long formal meetings.

Start Doing (+): Suggest new things!  You read or heard about something that helped others like you.  What do you have to lose?

Measuring Team Emotion

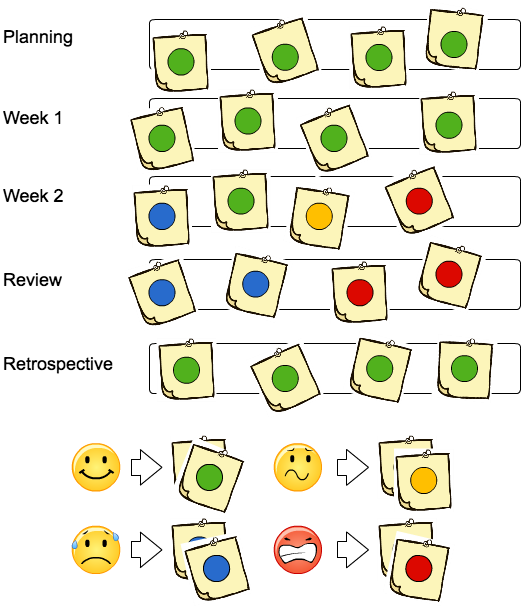
Team EmotionToo many times, companies focus too much attention on metrics like Team Performance and Team Efficiency, while ignoring metrics like Team Emotion or Happiness.  This last week,  I worked with a company and team which did not make this mistake. At the  conclusion of the iteration, they held a retrospective. As noted on a previous blog post,

a retrospective meeting is held at the end of a scheduled event or time interval. With the aid of a facilitator, a team discusses what went well and what could be improved during the next interval or prior to the next scheduled event.  The meeting is time-boxed to help ensure it doesn’t just turn into an out-of-control complaining session.  When properly facilitated, you come out of the meeting with an actionable list for improvement candidates.

At the conclusion of the team retrospective, it was time for the final task of the (2-week) iteration.  It was time to know how the team felt.

As you can see from this Cacoo drawing, the team was happy during iteration planning and the first week of the two-week iteration.  Things didn't go so well during the  second week or the Iteration Review. I was there during that meeting and not surprised they voted as they did.  What is telling from this diagram was their feelings of the actual Retrospective meeting.  They were very happy.

During the Retrospective,  the team discussed how they could make the next iteration (and Review) better.  It was a really healthy and productive conversation.  There was no blaming.  It was all about "how can we as a team do better?"

In closing, find out how your team feels.  You may be surprised how team performance and efficiency improve when the team is happier.  If you want true process or team improvement (Kaizen), track your feelings as well.


Coke Freestyle VMS

coke_freestyle_menu

coke_freestyle_menu

coke_freestyle_screen

coke_freestyle_screen

My family and I went into a California Tortilla the other night to grab a quick dinner. Off to the side I notice a long line of people waiting to fill their soda cups.  It used to be, when you went out for fast food, the people behind the counter would ask you what you wanted and they would hand it to you.  Now, at this location, it appeared it could take as long to get our drinks (in a separate line) as it would to get our food.  Though I appreciate this California Tortilla location wanting to empower the consumer by giving us 100+ choices of our favorite mixture of soda-pop, most people in line appeared paralyzed by the amount of combinations and permutations.  When I went into a different California Tortilla, I noticed an old-school fountain machine.  There was no line and I saw two people filling their soda cups at the same time.  It made me question the value the additional choices offered, especially when all I want is water.

So, I guess my question is, should there be fewer options or a better feedback tool for consumers to respond to?  When doing a little research on this post, I found a poster of a freestyle "menu" at Taco Mac.  I believe the use of this VMS (Visual Management System) could keep the lines short at the California Tortilla location.  But, I don't know.  Are there shorter (or no) lines at the Atlanta Taco Macs?  To shorten the lines at California Tortilla, I would propose they get the menus and hang a poster near the machine.  I think people would be more apt to decide what they wanted before they stand in front of this machine with 100+ choice presented to them.  I think it would cut down on people browsing the menu, while there is a line behind them.  My goal?  I want the cut down lead time and cycle time as much as possible.  Not sure what those are?  I found a great definition by Corey Ladas.

Lead time clock starts when the request is made and ends at delivery. Cycle time clock starts when work begins on the request and ends when the item is ready for delivery. Cycle time is a more mechanical measure of process capability. Lead time is what the customer sees.

Lead time depends on cycle time, but also depends on your willingness to keep a backlog, the customer’s patience, and the customer’s readiness for delivery.

Another way to think about it is: cycle time measures the completion rate, lead time measures the arrival rate. A producer has limited strategies to influence lead time. One is pricing (managing the arrival rate), another is managing cycle time (completing work faster/slower than the arrival rate).

I know you usually don't think of Agile or Lean when talking about fish tacos, burritos and soda-pop, but I had to get this off my chest.

Mieruka & Real World Examples

VMSradar-speed-sign

I just submitted my paper to be a speaker  at the PMI Global Congress on the topic of Visual Management Systems (VMS).  Some may know VMS as VCS (Visual Control Systems).   According to Wikipedia, Visual control is a technique employed in many places where information is communicated by using visual signals instead of texts or other written instructions. The design is deliberate in allowing quick recognition of the information being communicated, in order to increase efficiency and clarity. In the Toyota Way, it is also known as mieruka (making visible).  I love the wild and endless variety of real world mieruka! Today I was driving through a school zone when something caught my attention.  It wasn't a police officer yelling at cars to slow down.  It wasn't a sign that said "Slow Childern at Play".  It was a speed limit sign with a radar speed sign attached to it.  On the top you see the proposed speed limit and on the bottom you see the actual.  It wasn't snapping pictures of people speeding passed.  To the contrary, all it was doing was bringing attention to actual vehicle speeds.  As I wrestled to get my speed below 25MPH, I was amazed how well it worked.

Everyone around me slowed their vehicles down, with no more coercion than knowing their speed through real-time visualization control.

Media Source: Peds.org